





Table of Contents
Quick Summary:
- Ecommerce business intelligence connects scattered sales, marketing, inventory, and finance data into one trusted source for faster, better-backed decisions.
- Key benefits: faster decision-making, better customer experience, smarter budget allocation, less manual reporting.
- Main challenges: fragmented data, integration issues, choosing the right metrics over tracking everything.
- Cost ranges from $50,000 (basic) to $1,000,000+ (advanced, AI-driven).
- AI is shifting BI from static dashboards to natural-language copilots, automatic alerts, and systems that act on problems directly.
- Enterprise brands like Nestlé and Starbucks use it at scale; DTC brands see similar ROI with a lighter setup.
- Success depends on tracking profit-driven metrics and budgeting for ongoing maintenance after launch.
Ecommerce business intelligence brings sales, marketing, inventory, finance, and customer data into one trusted view, helping businesses make faster and more informed decisions. Instead of relying on disconnected reports, leadership teams can measure business performance using consistent data across every department.
As ecommerce businesses grow, data spreads across storefronts, marketplaces, advertising platforms, ERP systems, and customer service tools. Different teams often work with different reports, making it difficult to understand profitability, channel performance, or inventory health.
This guide explains how business intelligence for ecommerce works, its benefits, implementation costs, common applications, the KPIs that matter most, and the technologies shaping the next generation of business reporting.
What Is Ecommerce Business Intelligence?
Ecommerce business intelligence brings sales, marketing, inventory, finance, and customer data into one reporting system. Businesses use it to measure performance, compare results across channels, and make decisions using the same business data instead of separate reports.
An ecommerce business collects information from many sources, including ecommerce platforms, marketplaces, advertising channels, payment gateways, ERP software, and customer support systems.
Business intelligence for ecommerce connects these systems, allowing teams to monitor revenue, profitability, inventory, customer activity, and operational performance from one place.
Most enterprise catalogs wait on a nightly batch job before changes go live. Arvyn updates browse, facets, and previews in real time — no reindex, no delay.
Get Free Demo
5 Core Benefits of Ecommerce Business Intelligence
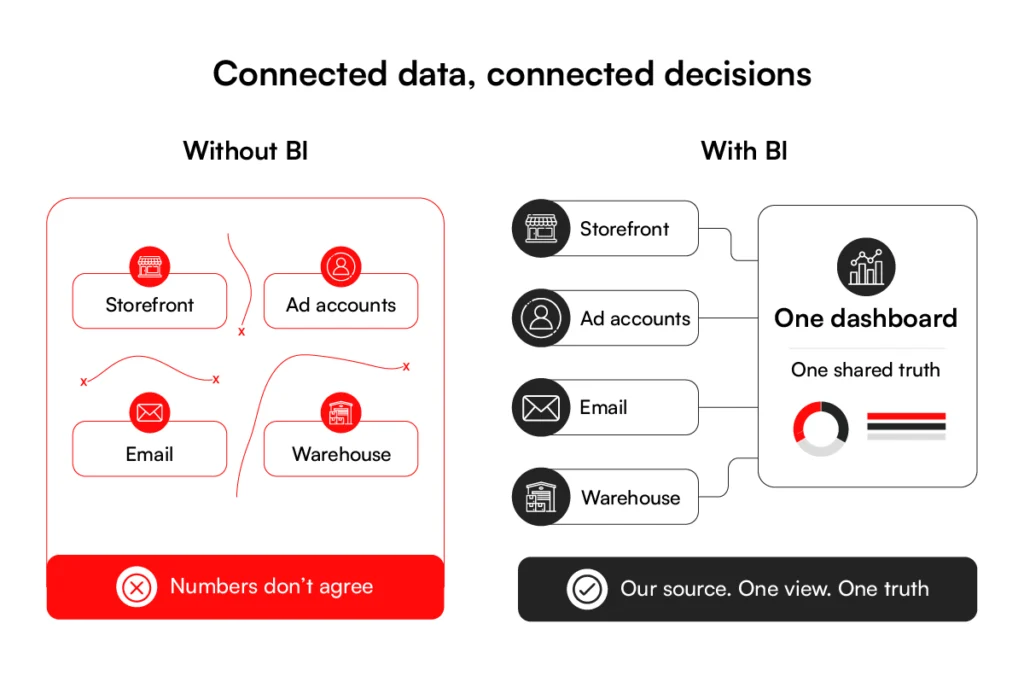
Ecommerce business intelligence gives sales, marketing, finance, and operations one shared view of business performance. Teams can spot problems earlier and act on the same information.
1. Better Business Decisions
Strong decisions depend on current business data. Business intelligence for ecommerce brings together sales, inventory, margins, and channel performance so teams can react while opportunities still exist.
If demand suddenly shifts to a different product category or region, merchandising teams can adjust pricing, replenish inventory, or update promotions before lost sales begin to affect revenue.
2. More Relevant Customer Experiences
Customers leave useful signals throughout their buying journey. Search history, previous purchases, returns, and support requests all reveal what customers want and where they face problems.
Business intelligence in ecommerce combines these signals into one customer view. Marketing teams create more relevant campaigns, while support teams resolve issues without asking customers to repeat information they have already shared.
3. Better Coordination Across Teams
Many ecommerce businesses spend more time debating numbers than solving problems because every department works from different reports. Finance, marketing, operations, and warehouse teams often measure performance differently.
With business intelligence ecommerce, everyone reviews the same information. Planning becomes easier because inventory shortages, shipping delays, and campaign performance are measured from one trusted source.
4. Higher Productivity
Preparing reports manually takes time away from work that creates value. Analysts often spend hours collecting information from multiple platforms before they can begin reviewing business performance.
Automated reporting removes much of that repetitive work. Teams can spend more time identifying trends, finding the reasons behind performance changes, and supporting business decisions instead of maintaining spreadsheets.
5. Stronger Sales and Marketing Performance
Marketing budgets deliver better results when spending follows current customer demand instead of last year’s performance. Commerce business intelligence shows which products, channels, and customer groups generate profitable growth.
The same information also helps businesses move budget toward stronger-performing campaigns, focus retention efforts on high-value customers, and stop investing in activities that no longer produce acceptable returns.
These benefits make ecommerce business intelligence a practical investment for businesses that want steady growth while keeping operating costs under control.
Want These Benefits Without the Manual Work?
Every benefit above depends on one thing: your data actually being connected. If your sales, marketing, and fulfillment numbers still live in separate tabs, that’s the gap to close first.
Talk to Our BI Team5 Common Challenges of Ecommerce Business Intelligence
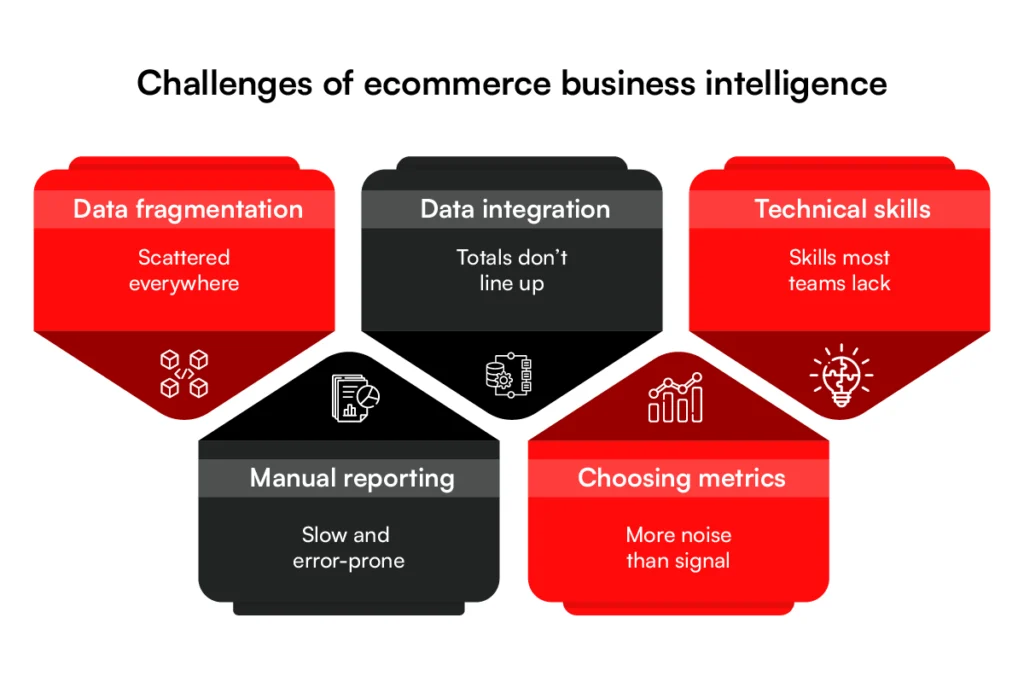
Ecommerce business intelligence starts with connected business data. When information is scattered across different systems, teams struggle to trust the numbers they see.
1. Data Fragmentation
Customer, order, inventory, marketing, and fulfillment data rarely live in one system. Most ecommerce businesses rely on several platforms, each storing information in its own format.
As more sales channels and business applications are added, reporting becomes harder. Teams spend more time matching numbers across systems before they can answer simple business questions.
2. Data Integration Challenges
Connecting different platforms is only part of the job. Each application records business events differently, which often leads to inconsistent reports.
For example, one system may record an order after payment, while another updates it after shipment. Small differences like these create reporting gaps and make channel performance harder to compare.
3. Technical Expertise
Building an ecommerce business intelligence platform requires skills in data engineering, data warehousing, and reporting. Many ecommerce businesses do not have these capabilities in-house, making it difficult to maintain reliable dashboards as systems and data sources change.
Even a small update to an API or database can cause reports to display incorrect information without immediate notice. Working with experienced teams or using ecommerce IT services helps businesses maintain stable data pipelines and keep reporting accurate as operations grow.
4. Manual Reporting
Manual reporting becomes harder as the business grows. Exporting spreadsheets from multiple systems, checking totals, and combining reports consumes valuable time every week.
The longer reporting takes, the older the information becomes. Business decisions often rely on numbers that no longer reflect current performance.
5. Choosing the Right KPIs
Modern reporting platforms can display hundreds of metrics, but more numbers do not always lead to better decisions. Large dashboards often distract teams from the measurements that directly affect revenue and profitability.
Businesses usually gain better results when reports focus on a small set of KPIs that support inventory planning, pricing, marketing performance, and contribution margin.
11 Key Ecommerce Business Intelligence Applications
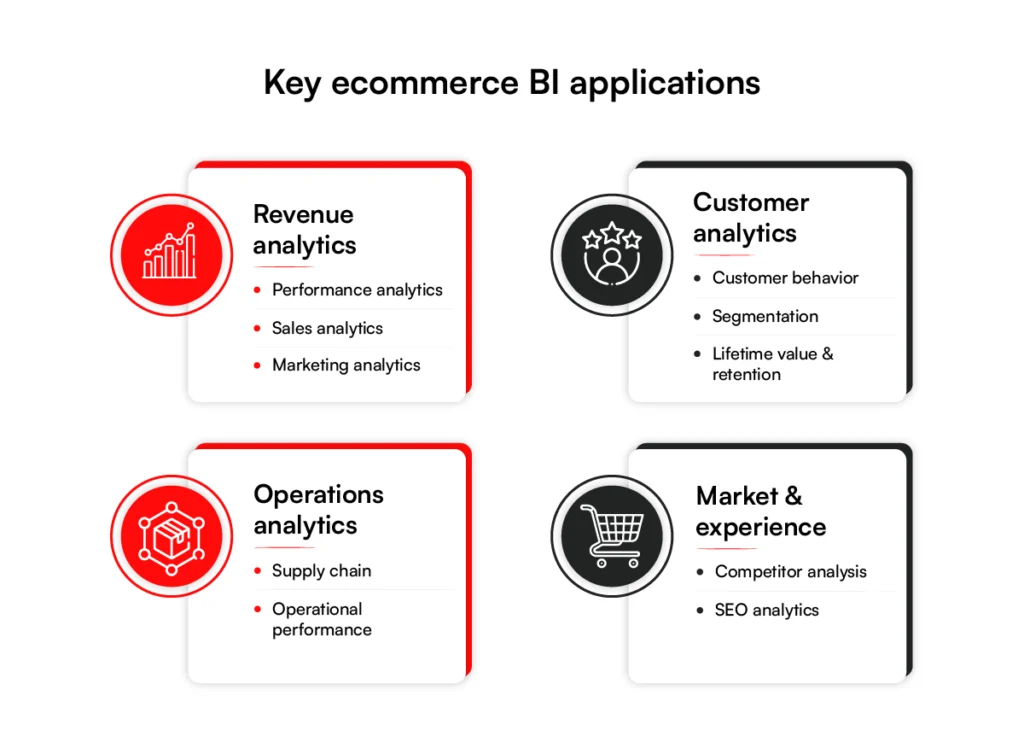
Ecommerce business intelligence organizes reporting across every major business function. Each application focuses on a different area of the business, giving teams the information they need without overlapping reports.
1. Ecommerce Performance Analytics
Ecommerce performance analytics combines revenue, orders, conversion rate, average order value, and customer metrics into a single business overview.
Leadership teams use these reports to monitor overall store performance and compare results across different reporting periods.
2. Sales Analytics
Sales analytics focuses on product sales, order volume, revenue by channel, discount performance, refunds, and conversion rates. These reports show where revenue is generated and how sales performance changes across products, categories, locations, and customer segments.
3. Marketing Analytics
Marketing analytics measures campaign performance across paid search, social media, email, affiliates, marketplaces, and other acquisition channels. Reports compare advertising costs, customer acquisition, conversions, and revenue generated by each marketing source.
4. Customer Analytics
Customer analytics examines shopping behavior throughout the customer lifecycle. Purchase history, browsing activity, repeat orders, returns, and engagement patterns provide a clearer understanding of customer behavior over time.
5. Customer Segmentation
Customer segmentation organizes shoppers into groups based on purchase frequency, spending patterns, product interests, geographic location, or lifecycle stage. Each segment can then be analyzed independently to understand differences in customer behavior.
6. Customer Lifetime Value and Retention Analysis
Customer lifetime value analysis measures long-term customer revenue, while retention analysis tracks repeat purchases, churn, and buying frequency. Together, these reports show how customer relationships change over time.
7. Supply Chain Analytics
Supply chain analytics follows inventory from suppliers to fulfillment. Inventory availability, stock movement, warehouse performance, replenishment cycles, and supplier activity are monitored to maintain product availability across sales channels.
8. Operational Performance Analytics
Operational analytics measures daily business operations after an order is placed. Order processing time, warehouse activity, shipping performance, delivery status, cancellations, and returns all contribute to operational reporting.
9. Competitor Analysis
Competitor analysis compares product pricing, promotional activity, assortment, availability, and marketplace visibility against competing retailers. Regular monitoring highlights changes across the competitive market.
10. SEO Analytics
SEO analytics reports on keyword rankings, organic traffic, landing page performance, click-through rates, and conversions from search engines. These reports measure how organic search contributes to ecommerce performance.
11. Customer Experience Analytics
Customer experience analytics examines every stage of the online shopping journey. Navigation behavior, search activity, checkout completion, page performance, customer feedback, and return reasons identify areas where the buying experience can be improved.
The AI & Agentic Era of Ecommerce Business Intelligence
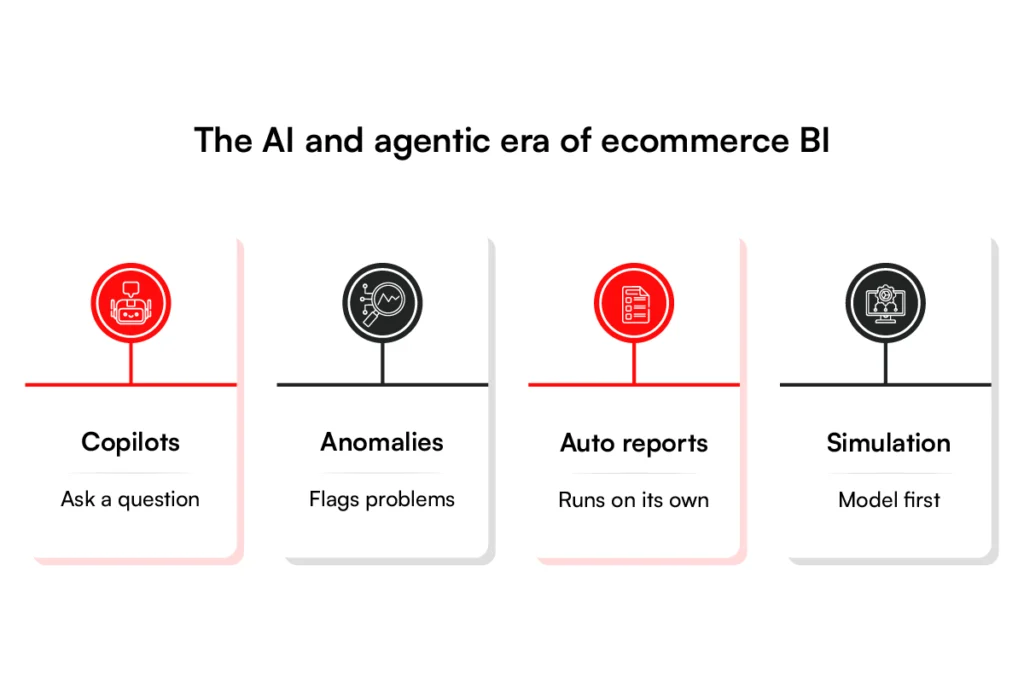
Modern ecommerce business intelligence platforms automate reporting, answer business questions, and help teams respond faster to changing business conditions.
1. Natural Language Search
Finding business information no longer requires building reports or writing database queries. Sales, finance, and marketing teams can ask questions in plain language and receive answers supported by current business data. This shortens reporting time and gives non-technical users direct access to the information they need.
2. Automated Anomaly Detection
Business performance changes throughout the day, making continuous monitoring more valuable than checking reports periodically.
Unusual changes in sales, inventory levels, advertising costs, or product returns are highlighted as they occur, allowing teams to investigate issues before they affect revenue or customer satisfaction.
3. Automated Reporting
Many reports follow the same schedule every week or month. Modern ecommerce business intelligence platforms generate recurring reports automatically and deliver them to the right teams without manual preparation. Analysts can spend more time reviewing business performance instead of compiling spreadsheets.
4. Scenario Planning
Pricing, inventory, and marketing decisions often involve financial risk. Scenario planning compares different business outcomes before changes are introduced, helping decision-makers estimate the impact on revenue, inventory, or profitability. Reviewing multiple outcomes before taking action reduces uncertainty and supports more informed planning.
Ecommerce BI Implementation Cost: A Complete Breakdown
The cost of ecommerce business intelligence depends on the number of integrations, reporting requirements, and the level of customization.
1. Main Cost Components
Several factors influence the total implementation cost of ecommerce business intelligence. Understanding these components helps businesses estimate the budget more accurately before development begins.
1.1 Business Intelligence Platform
The reporting platform is one of the first cost considerations. Some businesses choose licensed BI software with subscription pricing, while others invest in a custom solution designed around their reporting requirements. The right choice depends on reporting complexity, user volume, and long-term operating costs.
1.2 Data Warehouse
A data warehouse stores information collected from ecommerce platforms, payment gateways, ERP systems, CRM software, and marketing tools. Storage requirements increase as transaction volumes grow and businesses retain more historical data for reporting and trend analysis.
1.3 Data Integration and Engineering
Building reliable data pipelines often requires the largest technical investment. Information must be collected, standardized, and transferred from multiple systems before it can appear in reports. Many organizations work with data engineering services to build and maintain these integrations instead of relying on internal resources.
1.4 Implementation and Support
Implementation includes dashboard development, report configuration, testing, user training, and ongoing maintenance. As the business grows, reports and integrations usually require updates to support new sales channels, operational changes, or additional business requirements.
2. Estimated Implementation Cost
Implementation costs generally fall into three categories based on project complexity.
- Basic implementation: Core sales reporting with one or two business integrations — $50,000 to $170,000
- Mid-level implementation: Sales, inventory, customer, and marketing reporting across multiple systems — $200,000 to $400,000
- Enterprise implementation: Advanced reporting, forecasting, extensive integrations, and custom business logic — $400,000 to more than $1,000,000
3. Ongoing Costs
Implementation is only the beginning. APIs change, new sales channels are added, and reporting requirements continue to evolve as the business grows. Regular maintenance keeps dashboards accurate and prevents reporting problems caused by outdated integrations.
Faster data refresh cycles also influence business performance. When reports rely on yesterday’s data instead of current information, pricing, inventory, and purchasing decisions often arrive too late to deliver the best results.
Businesses that plan for long-term maintenance and continuous improvements generally achieve stronger returns from business intelligence for ecommerce than those that treat reporting as a one-time project.
Not sure which tier fits your business?
Talk to our teamReal-World Use Cases of Ecommerce Business Intelligence
Ecommerce business intelligence helps businesses improve decisions across sales, marketing, inventory, and operations.
1. Enterprise Examples
Nestlé consolidated business data from regional systems into a centralized reporting environment built on Azure. The new platform supports hundreds of operational reports used by sales and business teams across the organization.
Reporting automation also reduced manual reporting work, allowing teams to spend more time analyzing business performance and supporting sales decisions.
Starbucks uses business intelligence for ecommerce and location planning to evaluate market demand before opening new stores. Population, income, traffic patterns, competitor activity, and existing store locations all contribute to expansion decisions.
Customer purchasing data also supports product planning by identifying changing consumer preferences before new products are introduced.
2. Mid-Market / DTC Examples
Many mid-market ecommerce businesses begin with a much simpler ecommerce business intelligence setup. Sales, marketing, and customer data from ecommerce platforms, advertising channels, and email systems are brought together into a single dashboard to monitor revenue, profitability, and marketing performance.
Replacing spreadsheets with automated reporting gives decision-makers access to current business data instead of manually prepared reports.
Teams can identify underperforming campaigns, rising return rates, inventory issues, and profitable products much earlier, allowing them to respond before those problems affect revenue.
The Future of Ecommerce Business Intelligence
Ecommerce business intelligence is becoming more connected, faster, and easier to scale. As ecommerce businesses add new sales channels and customer touchpoints, reporting platforms will place greater emphasis on real-time data, unified reporting, and predictive business planning.
1. Unified Commerce Data
Businesses continue to sell through websites, marketplaces, social commerce, mobile apps, and physical stores. Future ecommerce business intelligence platforms will combine information from every sales channel into a single reporting environment, giving leaders a consistent view of business performance across the entire organization.
2. Real-Time Decision Support
Waiting for overnight reports will become less practical as businesses respond to changing demand throughout the day. Faster data processing will allow pricing, inventory, fulfillment, and marketing teams to work with current business information instead of delayed reports.
3. Predictive Business Planning
Historical reports explain previous performance, while future reporting platforms will place greater emphasis on forecasting. Demand, inventory requirements, customer purchasing patterns, and revenue trends will be projected using current and historical business data, helping businesses prepare for upcoming changes.
4. Composable Data Architectures
Ecommerce technology continues to evolve, with businesses adding new platforms as they grow. Future reporting environments will make it easier to connect ecommerce platforms, ERP systems, CRM software, marketplaces, and third-party applications without rebuilding the reporting infrastructure each time a new system is introduced.
5. Greater Business Accessibility
Business reporting is becoming available to more people across the organization instead of remaining limited to analysts. Sales, finance, operations, and marketing teams will access business information directly, reducing reporting delays and allowing decisions to move faster across every department.
Conclusion
Ecommerce business intelligence gives businesses a reliable way to turn everyday business data into better decisions. Connecting sales, marketing, inventory, operations, and customer data helps teams respond faster, reduce reporting errors, and improve profitability.
The right implementation does not have to begin with a complex platform. Many businesses start by connecting their core systems and expanding reporting capabilities as operations grow. Choosing meaningful KPIs and maintaining accurate data remain just as important as the technology itself.
If you’re planning to build or modernize an ecommerce business intelligence platform, RBMSoft offers ecommerce software development services to design and integrate a solution that fits your business goals.
Ready to get started? Schedule a consultation with RBMSoft’s team to discuss your ecommerce business intelligence requirements.
FAQs
1. What is the difference between ecommerce analytics and business intelligence?
Ecommerce analytics looks at a single channel or dataset, things like traffic, conversion rate, or ad performance, usually inside the platform that generated it.
Business intelligence pulls analytics from every channel into one connected system, so a team can see how marketing spend, inventory levels, and fulfillment costs all relate to a single number like true profit per order. Analytics answers “what happened on this channel.” BI answers “what’s happening across the business, and what should we do about it.”
2. How can ecommerce business intelligence improve profitability?
BI surfaces the numbers that actually drive margin, not just the ones that are easiest to track. A brand watching return on ad spend alone might keep funding a channel that looks efficient but loses money once returns, fulfillment cost, and discounting get factored in.
Connecting that data lets a team see contribution margin by channel, product, or customer segment, and reallocate spend toward what’s actually profitable instead of what looks good on a single metric.
3. How can ecommerce business intelligence reduce inventory and marketing waste?
On the inventory side, BI connects sales velocity with stock levels so a team can spot overstock or a looming stockout before it becomes a write-off or a lost sale. On the marketing side, it shows which channels and campaigns are driving profitable orders versus which ones are burning budget on customers who churn or return their purchases.
Both problems come from the same root cause, decisions made on incomplete data, and both get fixed the same way: connecting the numbers that used to live in separate systems.
4. What are the best practices for ecommerce business intelligence ELT pipelines?
Most modern ecommerce data stacks use ELT rather than the older ETL approach, loading raw data into the warehouse first and transforming it afterward, since cloud warehouses can run at that scale on demand.
A few practices make this reliable: use incremental loading so the pipeline only processes new or changed records instead of reprocessing everything each run, and keep raw source data intact and unedited so any metric can be recalculated later if a business question changes.
Building in data quality checks at each stage, not just at the end, catches a broken pipeline before it quietly feeds bad numbers into a dashboard.
5. How can AI agents interact with ecommerce data under business intelligence?
AI agents sit on top of the BI layer and act on what it finds, rather than just displaying it. An agent can watch for a return-rate spike or an inventory shortfall and trigger an alert, open a ticket, or adjust a threshold without a person checking a dashboard first.
The agent’s usefulness depends entirely on the data underneath it: a poorly connected or inconsistent data pipeline means the agent acts on bad information just as confidently as it would on good information.
6. Which Ecommerce Business Intelligence Tools Integrate Best With Shopify, BigCommerce, and ERP Systems?
The right tool depends heavily on which ERP a business runs. Boomi supports NetSuite and Dynamics 365 as prebuilt integrations, plus Shopify, Magento, and BigCommerce on the ecommerce side, and its event-driven architecture handles real-time sync well for teams with the engineering resources to configure it.
DCKAP Integrator covers a wider ERP range, including SAP, NetSuite, Dynamics 365, and distribution-focused systems like Epicor P21, alongside Shopify and BigCommerce.
For NetSuite specifically on BigCommerce, the integration syncs orders, inventory, customers, and financial data in real time, which covers most of what a mid-market brand needs without custom development.
7. How much does it cost to implement ecommerce business intelligence?
Cost tracks closely with complexity. A basic setup covering core sales and order metrics with one or two integrations typically runs $50,000 to $170,000.
A mid-complexity build spanning sales, inventory, and marketing across several systems runs $200,000 to $400,000, and an advanced setup with forecasting and full back-office integration can reach $400,000 to $1,000,000. The full breakdown, including what drives cost within each tier, is covered earlier in this guide.