

Table of Contents
Quick Summary:
- Retail growth depends on predictive analytics that improve demand forecasting accuracy, reduce stockouts, and protect profit margins.
- AI-powered models help retailers optimize inventory, personalize customer experiences, enable dynamic pricing, and strengthen supply chain agility.
- Real-world examples from global brands show how predictive analytics drives measurable gains in sales, operational efficiency, and customer loyalty.
- Successful implementation requires clean, unified data, scalable cloud infrastructure, cross-functional collaboration, and direct integration into workflows.
- A structured rollout approach, starting with focused pilots and scaling strategically, ensures faster ROI and lower transformation risk.
- Retail predictive analytics is becoming a baseline capability & businesses that act early gain a lasting competitive advantage.
How confident are you in your current demand forecasts? If your team still relies on historical averages and manual adjustments, you already know the risks. One wrong forecast can mean empty shelves during peak demand or excess stock that eats into margins.
Now, what if your systems continuously analyzed past sales, real-time transactions, local events, weather patterns, and customer behavior? They tell you what will sell, where it will sell, and when demand will spike.
You walk into your review meeting knowing your inventory decisions are backed by data, not assumptions. This is what retail predictive analytics brings to you. AI-powered demand forecasting improves accuracy significantly compared to traditional methods.
When you use smart inventory management and data-driven in-store optimization, you can increase sales by an average of 10% and strengthen your competitive position in the market.
And this shift toward intelligent forecasting is not just an operational upgrade. It is shaping the future direction of the entire retail industry.
The Key Benefits of Predictive Analytics in Retail Industry
If the future of retail clearly belongs to AI-driven forecasting and real-time decision making, then the benefits today are already tangible. Here is what you gain when you implement predictive analytics across your retail operations.
How Predictive Analytics Transforms Retail Performance
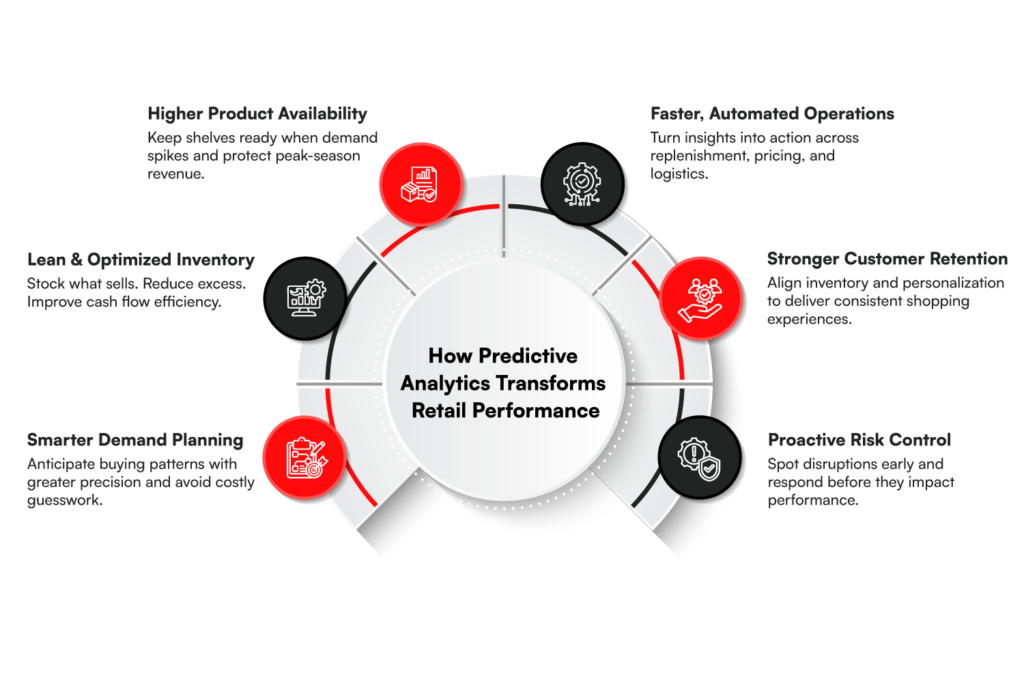
Improve forecast accuracy and protect revenue
When you implement AI-driven demand forecasting, you reduce forecasting errors significantly compared to traditional statistical models. McKinsey reports that companies using AI in supply chain forecasting can reduce errors by 20% to 50%.
That level of improvement directly reduces lost sales and emergency replenishment costs. It also allows you to plan promotions and seasonal demand with much higher confidence.
Reduce inventory costs and free up working capital
Better forecasts mean you stop over-ordering. According to McKinsey, AI-enabled supply chain management can reduce inventory levels by 20% to 30% while maintaining or even improving service levels.
This translates into improved cash flow and justifies investments in scalable data and cloud infrastructure that support real-time planning.
Cut stockouts and improve on-shelf availability
Advanced analytics helps retailers improve product availability and reduce stock-related inefficiencies. When you anticipate demand spikes instead of reacting to them, you protect revenue that would otherwise disappear due to empty shelves. Even small improvements in availability can generate meaningful sales uplift in high-volume categories.
Strengthen operational efficiency
AI optimizes replenishment, allocation, and logistics planning. Companies using retail predictive analytics in supply chain operations see significant performance improvements across cost, service levels, and responsiveness.
When your systems connect demand signals directly to execution, you shorten decision cycles and reduce manual intervention.
Increase customer satisfaction and loyalty
When customers consistently find the products they want, they return. Harvard Business Review has documented how data-driven personalization and analytics-driven inventory management improve customer retention and increase lifetime value.
Retail predictive analytics allows you to connect demand forecasting with personalization strategies, creating a seamless experience across channels.
Manage risk more proactively
Consumer preferences shift quickly. Supply chains face disruptions. Predictive models help you detect anomalies early and run scenario simulations before issues escalate. Instead of reacting to crises, you identify patterns, stress test scenarios, and make informed decisions before small issues turn into costly disruptions.
Are inaccurate forecasts slowing your growth?
We replace guesswork with AI-driven demand planning that improves accuracy, reduces excess inventory, and protects your margins.
Contact us
Use Cases & Real-life Examples of Predictive Analytics in the Retail Industry
Let’s walk through key use cases and see how well-known brands are already using retail predictive analytics to solve real challenges and drive measurable results.
1. Demand Forecasting to Avoid Stockouts and Overstock
Traditional forecasting often misses sudden shifts in demand. That leads to empty shelves during peak periods or excess inventory that eats into margins.
When forecasts are off, you either lose sales or carry capital-draining stock. AI predictive analytics for retail uses historical sales, seasonality, external data (like weather or local events), and real-time signals to forecast demand more accurately.
Models flag when demand will spike or drop so you can adjust inventory and replenishment plans ahead of time.
Example: Walmart uses predictive analytics at a massive scale. They analyze real-time POS data, online browsing patterns, regional buying trends, weather forecasts, and promotional history to predict product demand at the SKU and store level. Its machine learning systems continuously update forecasts instead of relying on static historical averages.
Before major holidays or seasonal shifts, the system anticipates demand spikes and adjusts replenishment plans in advance. Store-level forecasts guide distribution centers on how much inventory to ship and where to allocate it.
This helps Walmart reduce stockouts, avoid excess inventory, improve turnover, and protect margins. Instead of reacting to demand changes, it predicts them and acts early.
Source: Tech Walmart
2. Personalized Recommendations to Drive Sales and Loyalty
Generic merchandising and broad promotions don’t resonate with today’s customers. Without personalization, you miss chances to increase basket size and repeat purchases.
Predictive models analyze individual browsing and buying behavior to tailor product suggestions and marketing offers. This makes every customer feel understood and increases the likelihood of purchase.
Example: Amazon credits about 35% of its total sales to its recommendation engine. Amazon analyzes browsing history, past purchases, cart activity, search queries, product ratings, and even time spent on pages.
Its predictive models identify patterns in customer behavior and match users with products they are most likely to purchase. Recommendations appear across the homepage, product pages, emails, and checkout flow.
Instead of showing generic suggestions, the system personalizes each experience in real time. This increases average order value, improves conversion rates, and drives repeat purchases.
3. Customer Segmentation for Targeted Engagement
Treating all customers the same wastes marketing spend and limits conversion. You need to understand different segments to tailor offers, not just blast generic ads.
Retail predictive analytics segments customers based on behavior, purchase history, and value potential. Once segments are identified, retailers deliver customized promotions that resonate with each group.
Example: Starbucks uses predictive analytics on loyalty and purchase data to segment its customers. They analyze purchase history, visit frequency, preferred store locations, time-of-day patterns, and reward redemption behavior through its mobile app and loyalty program. Its models segment customers based on habits and preferences rather than broad demographics.
If a customer frequently buys cold beverages in the afternoon, the system sends a personalized offer during that time window.
If purchase frequency drops, it triggers targeted incentives to re-engage the customer. This data-driven personalization increases repeat visits, improves campaign performance, and strengthens long-term customer loyalty.
4. Agile Supply Chain Planning and Logistics Optimization
Manual planning and reactive supply chain decisions can’t keep pace with demand volatility. One delay cascades into stockouts, longer delivery times, and unhappy customers.
Visibility into future demand lets you optimize logistics, plan warehouse stock levels, and balance flows across channels. Predictive models help coordinate procurement, routing, and replenishment.
Example: Zara uses predictive analytics to power its agile supply chain. It analyzes sales data and trend signals to adjust production and distribution quickly, reducing excess inventory while keeping stores stocked with what customers actually want.
Zara continuously analyzes real-time sales data, store-level performance, customer preferences, and emerging fashion trends. Instead of locking production months in advance, it uses demand signals to adjust manufacturing volumes and distribution plans quickly.
If a specific style starts selling faster in certain regions, the system flags the trend early. Production shifts. Inventory moves to the right stores. Slow-moving designs are scaled back before they create excess stock.
This predictive, data-driven approach helps Zara reduce overproduction, maintain fresh inventory, and keep stores stocked with what customers actually want.
5. Dynamic Pricing to Maximize Profit and Competitiveness
Static pricing misses opportunities. Prices that are too high during low demand can hurt volume, and prices too low during peak demand erode margins.
Predictive pricing models use demand patterns, competitor pricing, and inventory levels to adjust prices in real time. This keeps prices competitive while protecting margins.
Example: Many leading e-commerce marketplaces use dynamic pricing engines that continuously monitor demand signals, competitor pricing, inventory levels, and customer behavior. Instead of relying on fixed price lists, these systems adjust prices automatically based on real-time market conditions.
When demand surges, prices may increase to protect margins. When competition intensifies or sales velocity slows, prices adjust to maintain competitiveness and conversion rates. These updates often happen multiple times a day across thousands of SKUs.
While implementations vary by platform, dynamic pricing has become a standard practice in competitive online retail. It enables businesses to protect profitability while staying responsive to market shifts.
6. Predictive Customer Feedback and Trend Monitoring
Waiting for customers to complain or surveys to come in means you’re always behind sentiment and trend shifts. Retail predictive analytics processes unstructured data like reviews and social posts to identify emerging issues or trend directions before they fully surface.
Example: Leading fashion and beauty brands rely on fast-moving trends and shifting consumer sentiment. They analyze reviews, social media conversations, influencer content, search trends, and user-generated content to spot early changes in preference. Instead of waiting for sales to drop, predictive models highlight rising interest in specific colors, styles, ingredients, or categories.
If online discussions increase around a skincare ingredient or fashion silhouette, analytics systems detect the spike early. Merchandising teams then adjust production, increase inventory for high-demand items, and accelerate relevant campaigns.
By tracking sentiment and digital conversations in real time, brands reduce the risk of missing trend shifts. They avoid overcommitting to fading styles and align inventory and promotions with what customers are about to want.
Challenges of Implementing AI Predictive Analytics in Retail and How to Overcome Them
Now, when you look at the use cases we just discussed, it is easy to focus on the upside. Better forecasts. Smarter replenishment. Higher sales. Stronger loyalty.
But implementing AI predictive analytics for retail at scale is not frictionless. The same complexity that makes these systems powerful also creates execution challenges. The difference between success and stalled transformation often comes down to how you handle these barriers.
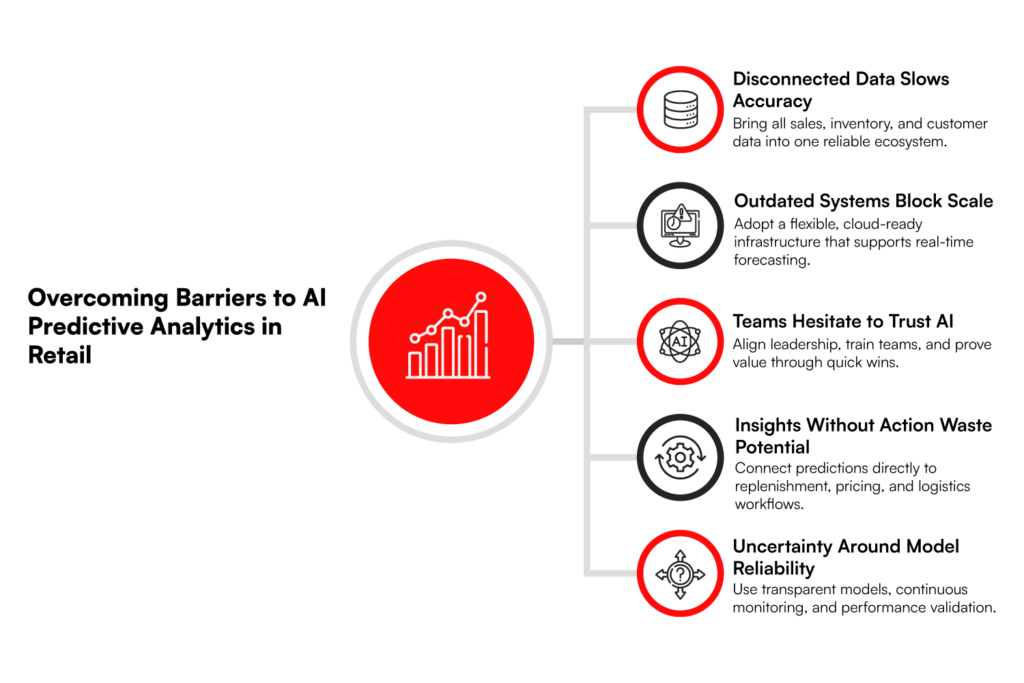
1. Fragmented and Poor Quality Data
Predictive models are only as good as the data you feed them. Many businesses still operate with siloed systems across POS, eCommerce, warehouse management, and CRM. Data is inconsistent, incomplete, or delayed. When data quality suffers, forecasts suffer.
Start with a data foundation strategy. Unify data sources into a centralized data platform, preferably cloud-based. Standardize definitions across systems. Invest in data governance early. You should treat clean, accessible data as a core infrastructure priority, not a side project. Without this layer, advanced analytics will never scale.
2. Legacy Systems that Cannot Scale
You may pilot a predictive model successfully, but your legacy infrastructure cannot support real-time processing or enterprise-wide deployment. That limits the impact to isolated use cases instead of full transformation.
Modernize in phases. Move forecasting workloads to scalable cloud environments. Use APIs to connect legacy systems while gradually replacing outdated components. The goal is not a big bang overhaul. It’s an architecture that allows predictive insights to flow directly into operational systems such as replenishment and pricing engines.
3. Organizational Resistance and Skill Gaps
Your merchandising and supply chain teams may trust experience more than algorithms. Planners might hesitate to rely on model outputs. At the same time, you may lack in-house data science expertise to build and maintain advanced models.
Drive adoption from the top. You need to frame predictive analytics in retail stores as a strategic priority. Start with high-impact pilots that clearly improve KPIs like forecast accuracy or inventory turns. Show measurable wins. Upskill internal teams and combine domain expertise with data science talent.
4. Difficulty Turning Insights into Action
Many retailers generate forecasts but fail to integrate them into execution. If predictive outputs sit in dashboards instead of triggering replenishment or pricing adjustments, you create insight without impact.
Embed predictive models directly into workflows. Connect forecasting outputs to automated replenishment systems. Align demand predictions with allocation and logistics planning tools. Move from “predict and report” to “predict and act.” This is where real ROI materializes.
5. Managing Risk and Model Trust
AI models can feel like black boxes. Leaders worry about model bias, incorrect assumptions, or overreliance on automation during volatile periods.
Implement explainable AI practices. Run scenario simulations and stress testing. Monitor model performance continuously and recalibrate when patterns shift. Treat predictive systems as living models that learn and adapt, not static tools deployed once and forgotten.
Is your demand planning reactive instead of predictive?
Move from historical guesswork to real-time, data-backed forecasting that drives confident business decisions.
Connect with us today!Tech Stack Required for Predictive Analytics in Retail
Now that we have addressed the challenges and how to overcome them, the next practical question is this. What technology foundation do you actually need to make predictive analytics work?
A strong tech stack does not just support forecasting models. It enables real-time data flow, automation, scalability, and continuous learning. Let’s break it down.
1. Data Collection Layer
Everything starts with data. You need structured and unstructured data from multiple sources. This typically includes POS systems, eCommerce platforms, ERP systems, warehouse management systems, CRM tools, loyalty programs, and supplier data.
External data such as weather feeds, economic indicators, and event calendars also strengthen forecasting accuracy. APIs and data ingestion tools help you pull this data into a centralized environment without disrupting existing operations.
2. Data Storage and Management Layer
Once you collect the data, you need a scalable storage system. Most modern retailers rely on cloud-based data lakes or data warehouses. These platforms allow you to store massive volumes of historical and real-time data while maintaining flexibility.
Cloud providers such as AWS, Microsoft Azure, and Google Cloud offer scalable infrastructure that supports both storage and analytics workloads. Data governance tools are equally important. You must ensure data quality, consistency, and security across departments.
3. Data Processing and Engineering Layer
Raw data is rarely usable in its original form. You need data engineering tools to clean, transform, and structure information before feeding it into predictive models.
This includes ETL or ELT pipelines, batch and real-time processing frameworks, and orchestration tools. This layer ensures your forecasting models receive accurate and standardized inputs.
4. Machine Learning and Analytics Layer
This is where predictive intelligence happens. Machine learning frameworks such as TensorFlow, PyTorch, and Scikit learn allow your data science teams to build demand forecasting, pricing optimization, and customer behavior models. Retailers also use AutoML platforms to accelerate model development.
Advanced analytics platforms help evaluate performance, compare model outputs, and retrain models as new data flows in.
5. Integration and Automation Layer
Forecasts create value only when they influence decisions. You need integration tools and APIs that connect predictive outputs directly to operational systems. For example, demand forecasts should feed into replenishment systems.
Pricing models should connect to dynamic pricing engines. Allocation predictions should guide distribution planning. Automation ensures that insights trigger actions without constant manual intervention.
6. Visualization and Decision Intelligence Layer
Executives and planners still need visibility. Dashboards and business intelligence tools translate complex model outputs into clear insights.
Platforms like Power BI, Tableau, or Looker help leadership teams monitor KPIs such as forecast accuracy, inventory turnover, service levels, and margin impact. This layer builds trust in the system and supports strategic oversight.
7. Governance, Security, and Monitoring
Predictive systems must remain reliable and compliant. You need monitoring tools to track model drift, performance degradation, and anomalies. Security frameworks must protect customer and transactional data. Compliance mechanisms ensure adherence to data protection regulations.
Steps to Implement Predictive Analytics for Retail
Predictive analytics only creates value when it is implemented with structure, discipline, and clear commercial goals. Random AI experiments do not improve retail performance.
A defined transformation roadmap does. At RBMSoft, we follow a structured process to integrate AI predictive analytics in retail to ensure it improves revenue, margins, and operational efficiency. Here’s our detailed framework.
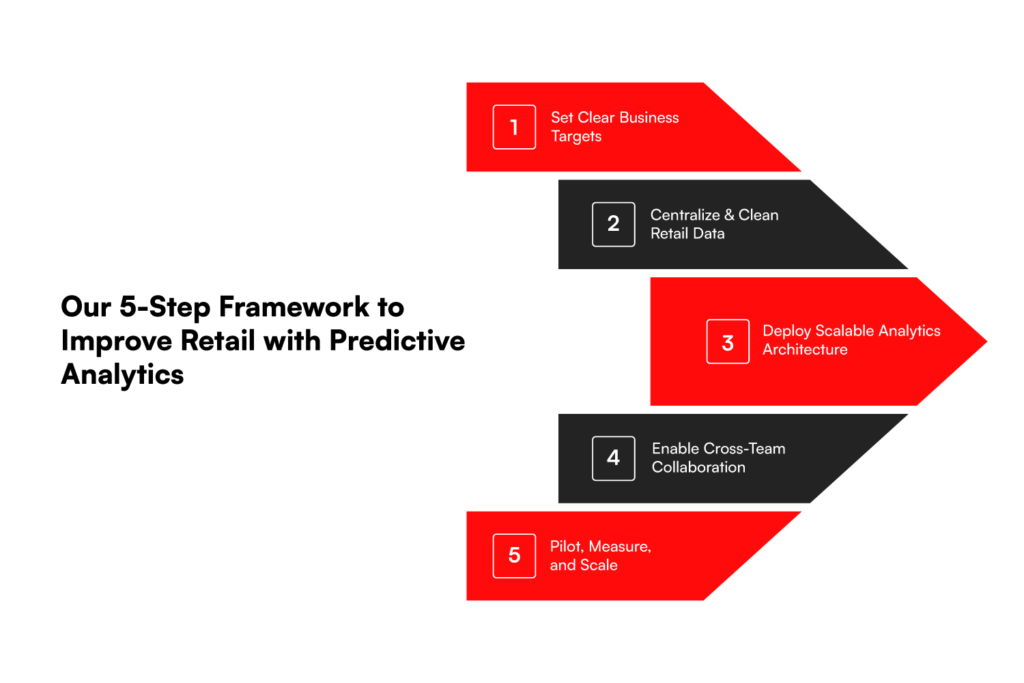
STEP 1 – Define Objectives
We begin with clarity. Before touching data or models, we work with leadership and operational teams to define precise business goals. Predictive analytics must solve a defined problem and not operate as a generic AI initiative.
Whether the objective is improving sales forecasting accuracy, reducing stockouts, optimizing pricing, or enhancing customer retention, we tie each goal to measurable KPIs such as revenue lift, margin improvement, inventory turnover, or churn reduction. This alignment ensures that every predictive model we build directly supports business growth.
STEP 2 – Data Collection
Once objectives are defined, we assess and unify the data ecosystem. Retail data often sits across POS systems, ERP platforms, CRM tools, eCommerce platforms, marketing automation systems, and supplier databases.
At RBMSoft, we consolidate historical and real-time data into a centralized, governed architecture. We clean inconsistencies, standardize product hierarchies, and ensure SKU-level and store-level granularity.
Accurate predictive retail analytics depends on reliable inputs. Without structured, high-quality data, even advanced models fail. This stage builds the foundation for consistent forecasting accuracy.
STEP 3 – Analytics Tools
Tool selection is not about choosing the most complex platform. It is about selecting the right technology stack that aligns with business scale, data maturity, and integration needs.
We design scalable architectures using cloud-native infrastructure, machine learning frameworks, and automated data pipelines. The focus remains on flexibility, speed, and long-term maintainability.
More importantly, we ensure predictive systems integrate seamlessly with ERP, inventory management, pricing engines, and marketing platforms. Insights must flow directly into operational workflows. That is where real value is created.
STEP 4 – Build Cross-Functional Teams
Retail predictive analytics cannot operate in isolation within IT. Retail success requires collaboration across merchandising, supply chain, marketing, finance, and technology teams.
At RBM, we create cross-functional implementation squads that align technical capabilities with operational realities. Category managers validate forecasting logic. Marketing teams align personalization models. Supply chain teams integrate replenishment automation.
This collaborative structure accelerates adoption and ensures predictive outputs translate into real decisions.
STEP 5 – Start with Pilot Projects
We do not recommend enterprise-wide deployment from day one. Instead, we launch targeted pilot programs focused on high-impact areas such as demand forecasting for a specific product category or churn prediction for a defined customer segment.
This allows us to measure improvement in forecast accuracy, inventory optimization, or campaign performance before scaling.
Once validated, we expand across categories, locations, and channels using a standardized deployment framework. Pilots reduce risk, demonstrate ROI quickly, and build internal confidence.
Replace manual forecasting with intelligent automation
We build AI-powered retail solutions that improve forecast accuracy, optimize inventory levels, and drive measurable business growth.
Talk to our expertsFuture and Market Trends of Predictive Analytics in Retail
As more retailers move from experimentation to full-scale deployment, the market is accelerating quickly. Analysts project that the retail predictive analytics market will grow at a compound annual growth rate of about 25% between 2024 and 2029.
The same research estimates the market will add more than USD 8 billion in value during that period. Looking further ahead, some projections suggest the predictive AI in the retail market could reach nearly USD 85.6 billion by 2034.
What is driving this growth?
First, retailers are moving toward real-time forecasting. Instead of updating plans weekly or monthly, companies now integrate live sales data, customer signals, and external inputs to adjust demand forecasts instantly.
Second, automation is increasing. Predictive systems no longer just forecast demand. They trigger replenishment decisions, adjust allocation across channels, and support dynamic pricing.
Third, personalization is becoming more precise. Retailers use predictive models to anticipate individual buying behavior and tailor offers accordingly. This improves conversion rates and strengthens customer lifetime value.
For you, this means retail predictive analytics will soon become a baseline capability. The real advantage will come from how deeply you integrate it into core operations, how quickly you act on insights, and how well your technology stack supports continuous learning.
Conclusion
If you’re still relying on static reports and reactive planning, you’re leaving revenue and efficiency on the table. Predictive retail analytics gives you the clarity to act before problems hit your margins. It also gives you confidence to make smarter decisions every day.
At RBM Soft, we provide tailored IT services for retail Industry to help drive measurable growth. If you’re ready to improve forecast accuracy, reduce inventory waste, and build a smarter retail operation, let’s start the conversation and turn your data into a competitive advantage.
FAQ’s
1. How long does it take to implement predictive analytics in retail?
The implementation timeline depends on your existing data infrastructure, business complexity, and deployment scope. A focused pilot, such as demand forecasting for a specific category or region, can typically be implemented within a few weeks.
A broader rollout across multiple channels, warehouses, and stores may take between four and nine months. Retailers with fragmented data or legacy systems may require additional time for data consolidation and integration. A phased approach ensures faster ROI while minimizing operational disruption.
2. How much does it cost to develop and integrate predictive analytics in retail?
Building and integrating predictive analytics in retail typically requires a significant upfront investment, often ranging from $50,000 to $350,000 or more.
In addition, businesses should plan for ongoing annual costs covering SaaS platforms, data infrastructure, maintenance, and skilled personnel, which can range from $10,000 to $100,000 or higher. These figures are general estimates.
The actual investment depends on your business size, data complexity, integration scope, technology stack, and deployment approach.
3. What is the role of AI in predictive analytics for retail, and how will it help businesses?
AI drives predictive analytics. It analyzes sales patterns, customer behavior, promotions, seasonality, and external signals in real time. It learns continuously and improves forecast accuracy.
With our predictive analytics services for retail, you can use AI to predict demand, optimize pricing, personalize campaigns, and automate replenishment. You stop reacting to problems. You start making proactive, data-backed decisions that reduce risk and increase profitability.
4. How does predictive analytics transform inventory forecasting in the retail industry?
Predictive analytics transforms inventory forecasting by moving beyond static spreadsheets and manual adjustments. It analyzes historical data alongside real-time signals to anticipate demand spikes and slowdowns before they occur.
In predictive analytics in retail stores, this means replenishment decisions can be automated, and inventory allocation can be optimized across locations. The result is fewer stockouts, lower excess inventory, better working capital management, and improved customer satisfaction.
5. What is predictive analytics in retail sales?
Predictive analytics in retail sales uses data-driven models to forecast future buying behavior. It evaluates historical transactions, seasonal patterns, promotional impact, and customer engagement signals to predict what products will sell, when demand will increase, and which customer segments are most likely to convert.
This allows retailers to plan promotions more effectively, align inventory with demand, and improve overall sales performance through informed decision-making.
6. How much can predictive analytics increase retail sales?
Sales impact varies depending on execution quality and business maturity. Many retailers report sales improvements when predictive models are integrated into inventory planning and personalization strategies.
Increased product availability, better-targeted promotions, and optimized pricing directly contribute to revenue growth.
A well-executed retail predictive analytics case study often demonstrates that even modest improvements in forecast accuracy can generate significant financial returns at scale.
7. What types of data do retailers use for predictive analytics?
Retailers rely on a combination of transactional, behavioral, operational, and external data. This includes POS sales records, inventory levels, CRM data, loyalty program insights, website interactions, marketing campaign performance, supplier lead times, and external inputs such as weather data or regional events.
The effectiveness of any predictive analytics solution for retail depends heavily on how well this data is unified, cleaned, and structured.
8. What are the four steps in predictive analytics?
Predictive analytics typically follows four core stages: data collection, data preparation, model development, and deployment with continuous monitoring. Retailers first gather relevant historical and real-time data, then clean and structure it to ensure accuracy.
Machine learning models are built to detect patterns and generate forecasts. Finally, predictions are integrated into operational systems and continuously refined to maintain performance. Treating this as an ongoing cycle